TemPy: An IoT Architecture with Raspberry Pi and Skupper

Description
This project is a proof of concept for an IoT architecture using a Raspberry Pi and a temperature sensor that exposes the temperature data through a REST API. Along with the REST API, there is a cloud integration with any cloud provider using Skupper that enables the data to be visualized in a Grafana dashboard.
Clone the repository and follow the instructions to run the project. https://github.com/rafaelvzago/skupper-tempy
1
git clone https://github.com/rafaelvzago/skupper-tempy.git
Table of Contents
- Hardware
- Raspberry Configuration
- Temperature Capture
- Skupper Role
- Connection to a cluster using skupper and storage data into prometheus
- Prometheus
- Grafana
- Repository
Architecture
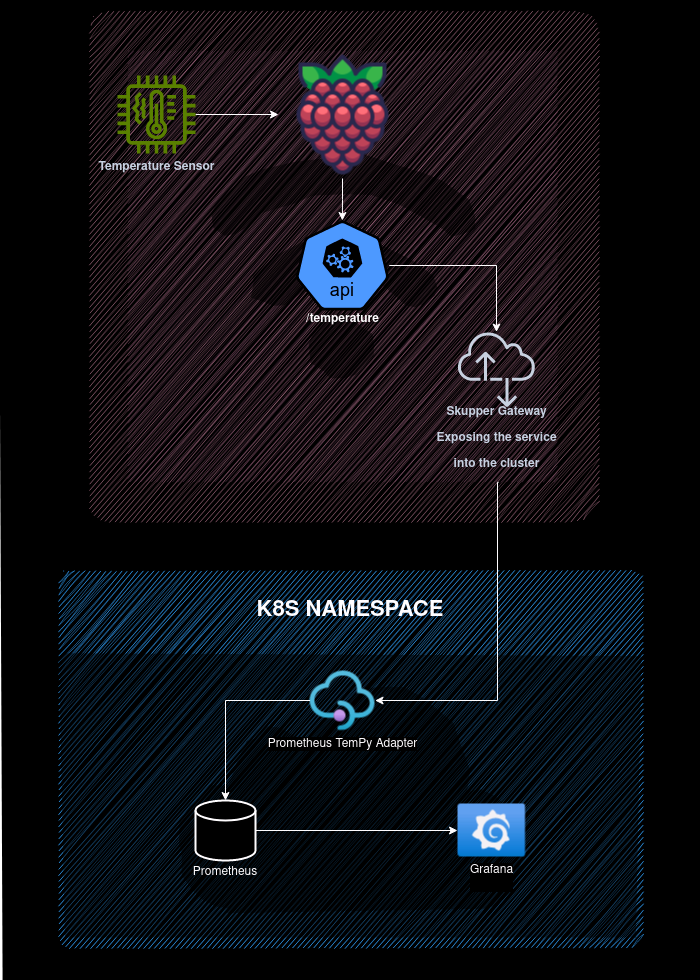
The architecture of the project can be divided into the following parts:
Hardware
This part involves the physical components used in the project, such as the Raspberry Pi and the temperature sensor.
- Raspberry Pi 3 Model B+ Raspberry Pi 3 Model B+
- DS18B20 Temperature Sensor DS18B20 Temperature Sensor
- 4.7kΩ Resistor 4.7kΩ Resistor
- Breadboard Breadboard
- Jumper Wires Jumper Wires
Raspberry Configuration
This part focuses on the setup and configuration of the Raspberry Pi, including installing the necessary software and libraries.
- Ubuntu 23.04 server for Raspberry Pi Ubuntu Installation
- GoLang 1.18+ GoLang Installation
- Skupper Main Skupper Installation
- Podman > 4.3 Podman Installation
Temperature Capture
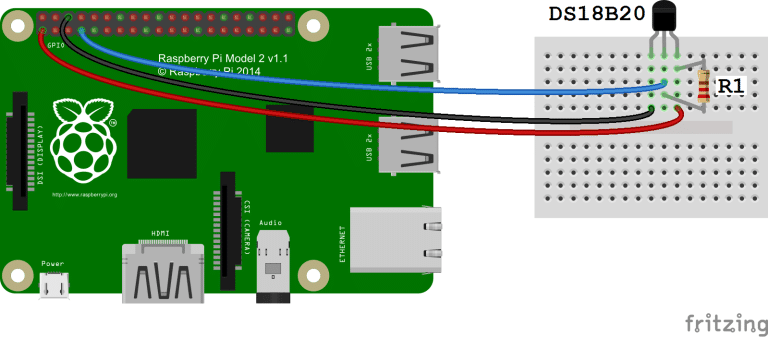
In this part, the temperature sensor is connected to the Raspberry Pi, and the code for capturing temperature readings is implemented.
Configuration:
- Raspberry Pi GPIO Pins:
- Pin 1 (3.3V) is connected to the VDD pin of the DS18B20.
- Pin 7 (GPIO 4) is connected to the DQ pin of the DS18B20.
- Pin 9 (GND) is connected to the GND pin of the DS18B20.
- DS18B20:
- The VDD pin is powered by 3.3V from the Raspberry Pi.
- The DQ pin is connected to GPIO 4 with a pull-up resistor.
- The GND pin is grounded to the Raspberry Pi.
Connections:
- A 4.7kΩ pull-up resistor (R1) is placed between the VDD and DQ lines.
- The VDD line from the DS18B20 is connected to a red wire representing 3.3V from the Raspberry Pi.
- The DQ line is connected to a white wire representing data and is connected to GPIO 4 on the Raspberry Pi.
- The GND line is connected to a black wire representing ground from the Raspberry Pi.
Functionality:
- The DS18B20 temperature sensor reports temperature data through the 1-Wire interface, which requires only one data line (and ground) for communication with the Raspberry Pi.
- The pull-up resistor is necessary for the 1-Wire protocol used by the DS18B20 to function correctly.
REST API:
- To expose the temperature data, a REST API is implemented using GoLang. The API is used to capture the temperature data and expose it to the cloud provider.
1
go build tempy/tempy.go
- Find a way to run the tempy binary on the Raspberry Pi, for this example I will use a simple nohup command to run the tempy binary in the background.
1
nohup ./tempy &
- The REST API is exposed on port 5000/temperature, and the temperature data can be accessed using the following command:
1
curl localhost:5000/temperature
Skupper Role
We will use Skupper to establish communication between the Raspberry Pi and the cloud provider, and to expose the temperature data to the cloud. This part covers the setup and configuration of Skupper.
Skupper is a layer 7 service interconnect that enables secure communication across Kubernetes clusters, including network and application layer protocols. Skupper is designed to connect services that are running on different infrastructure, and it is based on the idea of a service bus. Skupper
In this example we will be using skupper gateway to expose the temperature data to the cloud, for this we will need to have a skupper site running on the cloud and a skupper gateway running on the Raspberry Pi. Skupper gateway is a component that allows non-kubernetes services to be exposed to the skupper network, in this case we will use the skupper gateway to expose the temperature data to the cloud.
Skupper site:
- A namespace running skupper, for this example we will borrow the prometheus service to store the temperature data, so we will init skupper on the cluster with the following command:
1
skupper init --site-name site1 --enable-console --enable-flow-collector
Skuper gateway on the Raspberry Pi:
- To expose the temperature data to the cloud, we will use a skupper gateway to expose the temperature data to the cloud, for this we will use the following command:
1
 skupper gateway expose tempy localhost 5000 --type podman
Connection to a cluster using skupper and storage data into prometheus
The temperature data captured by the Raspberry Pi is stored in the cloud using the chosen cloud provider. This part explains how the data is stored and managed.
For this example, we will deploy a prometheus service to store the temperature data, and a prometheus-adapter to scrape the temperature data from the REST API and store it in the prometheus service. In order to facilitate the prometheus role, we will configure the prometheus service discovery to scrape the temperature data from the prometheus-adapter or any other service labeled as app=metric. with this approach, we can easily add more temperature sensors to the architecture and the prometheus service will automatically scrape the temperature data from the new sensors.
In order to achive this, the service will be labeled as app=metric, and the prometheus-adapter will add the temperature data to the service, so the prometheus service will scrape the temperature data from the prometheus-adapter.
1
2
3
4
5
6
7
8
apiVersion: v1
kind: Service
metadata:
  name: tempy-prometheus-adapter-service
spec:
  type: ClusterIP
  selector:
    app: metrics
Prometheus Adapter:
- Build the TemPy prometheus-adapter image:
1
podman build -t quay.io/YOUR-USER/tempy-prometheus-adapter:0.1 -f prometheus-adapter/Dockerfile-TempyPrometheusAdapter .
- Push the image to the quay.io registry:
1
podman push quay.io/YOUR-USER/tempy-prometheus-adapter:0.1
- Deploy the prometheus-adapter:
1
kubectl apply -f prometheus-adapter/TempyPrometheusAdapter-deployment.yaml - Expose the prometheus-adapter:
1
kubectl apply -f prometheus-adapter/TempyPrometheusAdapter-service.yaml - Verify the prometheus-adapter is running:
1
2
3
4
5
6
7
8
kubectl run -i --tty --rm curl-pod --image=curlimages/curl -- sh
curl tempy-prometheus-adapter:9090/metrics
...
# TYPE temperature_celsius gauge
temperature_celsius 19.81
# HELP temperature_fahrenheit Current temperature in Fahrenheit
# TYPE temperature_fahrenheit gauge
temperature_fahrenheit 67.66
- CHeck the prometheus-adapter sservice to check if the labels are being added to the service:
1
2
3
kubectl get svc tempy-prometheus-adapter-service -o wide
NAME                               TYPE        CLUSTER-IP      EXTERNAL-IP   PORT(S)    AGE   SELECTOR
tempy-prometheus-adapter-service   ClusterIP   10.43.154.250   <none>        9090/TCP   11h   app=metrics
Prometheus
The temperature data is stored in a prometheus service. This part covers the setup and configuration of the prometheus service. We need to persist the data, so we will use a PVC, in my case I will use the longhorn storage class, but you can use any storage class that you have available in your cluster.
This is a part of the prometheus configuration file, it is configured to scrape the temperature data from any service labeled as app=metrics, so the prometheus service will scrape the temperature data from the prometheus-adapter. Note that this configuration will only look for services labeled as app=metrics in the skupper-pi namespace, so if you are using a different namespace, you will need to change the configuration file accordingly.
1
2
3
4
5
6
7
8
9
10
11
12
...
      - job_name: 'metrics-targets'
        scrape_interval: 5s
        kubernetes_sd_configs:
          - role: service
            namespaces:
              names: ['skupper-pi']
        relabel_configs:
          - source_labels: [__meta_kubernetes_service_label_app]
            regex: metrics
            action: keep
...
- Create prometheus PVC:
1
kubectl apply -f prometheus/prometheus-pvc.yaml - Create prometheus deployment:
1
kubectl apply -f prometheus/prometheus-deployment.yaml - Configuring the prometheus service discovery to scrape the temperature data from any service labeled as app=metrics:
1
kubectl apply -f prometheus/prometheus-cm.yaml - Deploy the prometheus:
1
kubectl apply -f prometheus/prometheus-deployment.yaml - Create prometheus service:
1
kubectl apply -f prometheus/prometheus-service.yaml - Verify the prometheus is running, from this point on, the prometheus service should be scraping the temperature data from the prometheus-adapter or any other service labeled as app=metrics, let’s query all the services discovered by prometheus:
1
2
3
4
5
6
7
8
9
10
11
12
13
14
15
16
17
18
19
20
21
22
23
24
25
26
27
28
29
30
31
32
33
34
35
36
37
38
39
40
41
42
43
44
45
kubectl run -i --tty --rm curl-pod --image=curlimages/curl -- sh -c 'curl -G --data-urlencode "query=up" http://prometheus:9090/api/v1/query' | jq .
If you don't see a command prompt, try pressing enter.
warning: couldn't attach to pod/curl-pod, falling back to streaming logs: Internal error occurred: error attaching to container: container is in CONTAINER_EXITED state
{
  "status": "success",
  "data": {
 "resultType": "vector",
 "result": [
   {
     "metric": {
       "__name__": "up",
       "instance": "localhost:9090",
       "job": "prometheus"
     },
     "value": [
       1708523706.121,
       "1"
     ]
   },
   {
     "metric": {
       "__name__": "up",
       "instance": "promock.skupper-pi.svc:80",
       "job": "metrics-targets"
     },
     "value": [
       1708523706.121,
       "1"
     ]
   },
   {
     "metric": {
       "__name__": "up",
       "instance": "tempy-prometheus-adapter-service.skupper-pi.svc:9090",
       "job": "metrics-targets"
     },
     "value": [
       1708523706.121,
       "1"
     ]
   }
 ]
  }
}
...
Grafana
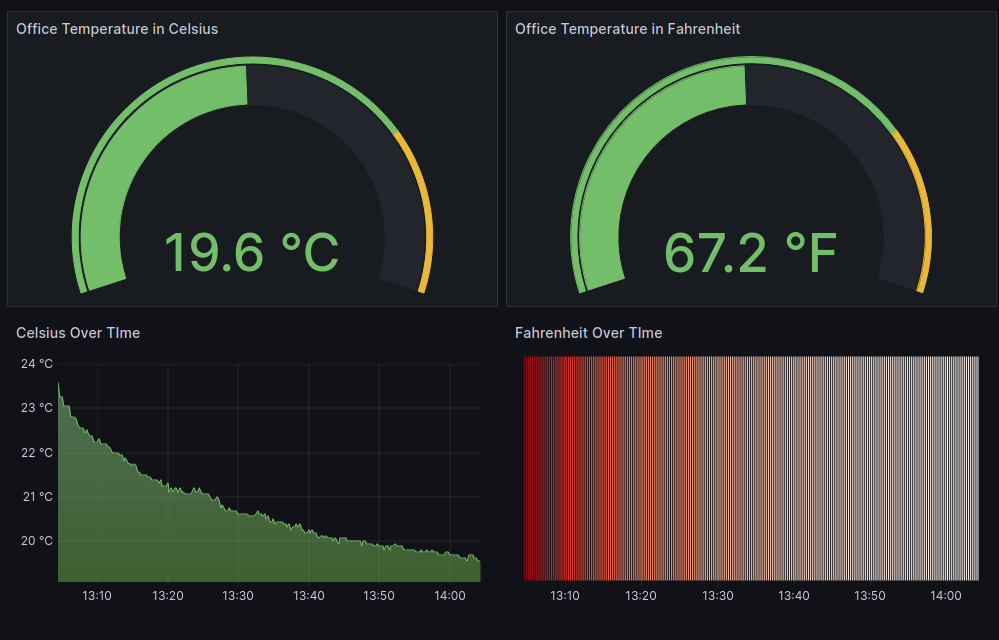
The stored temperature data is visualized in a Grafana dashboard. This part covers the setup and configuration of the dashboard.
To visualize the temperature data, we will use a Grafana dashboard. The dashboard is configured to scrape the temperature data from the prometheus service and visualize it in a graph. The grafana deployment is done using the following command:
For the data persistence, we will use a PVC to store the grafana data, in my case I have longhorn installed on my cluster, so I will use it to store the grafana data, but you can use any other storage class that you have available on your cluster.
- Create grafana PVC:
1
kubectl apply -f grafana/grafana-pvc.yaml - Create grafana deployment:
1
kubectl apply -f grafana/grafana-deployment.yaml - Create grafana service:
1
kubectl apply -f grafana/grafana-service.yaml
Important: My cluster is configrued to use the ingress controller, so I have to create an ingress to expose the grafana service, if your cluster is not configured to use the ingress controller, you will neeed either to expose the grafana service using a nodeport or a loadbalancer.
- Create a data source connection in grafana that points to the prometheus service:
1
http://skupper-prometheus:9090
- Import the grafana dashboard:
1
grafana/dashboard.json
- FINALY, you should be able to visualize the temperature data in the grafana dashboard.
Repository
The complete code for the project can be found in the following GitHub repository: TemPy